Global warming is going to kill you.
Sep 11, 2017 10:03:06 #

bdamage wrote:
That's it....all you got to say?
Nothing to "prove" what I posted to be wrong?
If you look at the "title" of this thread, what I posted has everything to do with the subject.
And since you have a "no response" response, I will simply come to the conclusion that you have nothing to say and no "facts" to dispute my post.
Typical Morgan.
Why can't you people every read what is actually written? I never said it hadn't had anything to do with the thread, I said it had nothing to do with my quote you quoted me from to lindajoy. Your answer is included in the one to Superdave. As far as facts where are yours and Dave's?
Sep 11, 2017 10:05:56 #
JRuss wrote:
We Now Have Global Cooling! br br Science and Eng... (show quote)
How do you say no change it went up from 0 to .5...? That is indicative a of a steady increase.
Sep 11, 2017 10:18:35 #

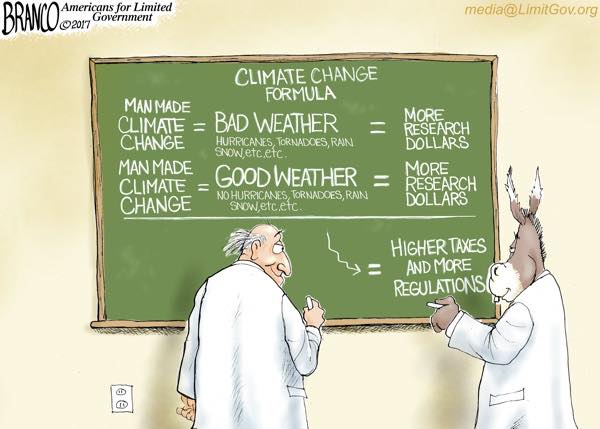
Morgan wrote:
According to the multinational Arctic Climate Impa... (show quote)
Do you always post cartoon pics as scientific "evidence"?
How quaint.
Check out topic: Can you IMAGINE Biden asking this of his cabinet (or his son)???
Sep 11, 2017 17:59:53 #
bdamage wrote:
Do you always post cartoon pics as scientific "evidence"?
How quaint.
How quaint.
Here' what'sreally funny, your reply is no surprise.
Sep 12, 2017 22:53:50 #

nwtk2007 wrote:
Obama himself, said many times, DACA is not conditional and not legal; that it would be shot down.
Wow, lots of pages later...
So... EVERYTHING is conditional (if you want to get large and philosophical). There are many things on which DACA is not predicated - Obama could have been referring to DACA's relevance to whatever qualification as not conditional. And of course, an executive order isn't a law, so it's not legal in the technical sense. This is why it's so funny to see people cheering a president who in his first session with Congress could not pass a single law.
He is the lawless jack-ass president. LOL!
(Dang, it feels good to say that)
Sep 12, 2017 22:55:33 #
Super Dave wrote:
LOL... Being right means being a 'denier'.
LOL
...(you mean... "right" as in "correct", or "right", as in...
Sep 13, 2017 00:50:13 #
lindajoy wrote:
Sorry straight up but I was curious with your figures so I went looking to see for myself..

lindajoy wrote:
I couldn't find anything that suggested such, would you mind sharing your numbers with us??
I couldn't find anything that suggested such, would you mind sharing your numbers with us??
Ooh... "crouching tiger", wait quiety for me to make a mistake... I see... ;)
Well, here's the link...
https://www.wunderground.com/hurricane/hurrarchive.asp
And here's the thing...
I was so excited to find the data in tabular format so I could just copy/paste into a spreadsheet and get it to spit out numbers that I failed to verify a second source. Looking at the web site, I don't actually see where it says it gets the data. So, I went looking for international records and for some reason I am having a hard time trying to find any... other than what I used. NOAA and NASA only seem focused on storms that hit the U.S.
Anyway... I gotta put a time limit on how much time I can spend on this, so I'm just going to say my numbers are as good as the source I gave you, so you can accept them or dispute them, but I will say the bigger argument I was trying to make with those numbers is that you can't limit the scope of your study to only part of the problem if you want to see the big picture. Meanwhile, I'll probably look further for sources of data on storms world wide.
Oh, one more thing to point out... it's not just the frequency of the storms, it's the size. Irma is the largest hurricane ever recorded anywhere in the world at any point in history. The storms themselves are getting bigger. Here's the news on that...
http://www.npr.org/sections/thetwo-way/2017/09/12/550188154/hurricane-irma-blasts-into-the-record-books-with-lasting-intensity
lindajoy wrote:
br Here's a couple I read~~ br br https://www.ep... (show quote)
Exactly... You can see what I'm talking about just in this figure alone... The rise in activity from about 1993 isn't as pronounced along the red line representing the hurricanes that hit the U.S. as it is along the green line representing the observations that didn't need to be adjusted, taken in Atlantic, Carribean and Gulf of Mexico. Imagine the difference if you included the Pacific and Indian oceans?
So, thanks for that data... It proved my point nicely.
lindajoy wrote:
According to the total annual ACE Index, cyclone intensity has risen noticeably over the past 20 years, and six of the 10 most active years since 1950 have occurred since the mid-1990s (see Figure 2). Relatively high levels of cyclone activity were also seen during the 1950s and 1960s.
According to the total annual ACE Index, cyclone intensity has risen noticeably over the past 20 years, and six of the 10 most active years since 1950 have occurred since the mid-1990s (see Figure 2). Relatively high levels of cyclone activity were also seen during the 1950s and 1960s.
There are always going to be spikes, the thing to note is if the spikes are getting bigger... and this chart says they are... 1995, 2005 and 2006 all had a higher energy index than ANY of the 50's or 60's. There's a lot more too global warming than CO2 levels. There is also a host of natural influences... ya know... the one's deniers always seem to think excuses us from any responsibility. Some of these influences are cyclic. So it makes sense that you would see energy spikes, throughout history, but are they getting bigger?
lindajoy wrote:
br The PDI (see Figure 3) shows fluctuating cyclo... (show quote)
So are you saying the numbers aren't perfect? Is that what you're waiting for?
Here's the lesson I'm learning here...
Global climate is a highly dynamic system affected by a tremendous number of influences and what data we seem to have about storms appears to be limited to specific regions and observation methods. So exact numbers would seem to be a pretty tall order, which I suppose makes it a great argument for deniers. For people who are less concerned about winning arguments and more concerned about the future of our children the question of numbers becomes a matter of risk assessment, something insurance companies are familiar with. So we deal with ranges and ratios, not exact numbers.
And we look at everything.
Not just hurricanes in one part of the world.
Sep 13, 2017 02:39:47 #
lindajoy wrote:
I'd like you to show me where I said any such twist you try to lay in this post..
I said the people claiming hurricanes were the result of climate change were dumb and they are..
Please do not attempt to alter my posts with your comprehension of them..
I said the people claiming hurricanes were the result of climate change were dumb and they are..
Please do not attempt to alter my posts with your comprehension of them..
That's a good point to make linda... you might consider the possibility that your own comprehension of someone else's claim might not be 100% accurate either. I do see a lot of claims that global warming is making hurricanes stronger or more frequent and I see a lot of people misreading that and assuming they mean "causing" hurricanes. Maybe not you, but enough to see a stereotype.
Sep 13, 2017 08:34:17 #

straightUp wrote:
So are you saying the numbers aren't perfect? Is t... (show quote)
My post was an inquiry given my inability to find more on what you said..
I supplied the data I read and shared it with you helping your comments or not..
It's an interesting topic and learning a great tool from it..
As for winning an argument or not is that your purpose when posting or in your rebuttal?? If so, why??? Is that important to you?? If so , why?? Debating an issue is to learn more from it not massage an ego..
Sep 13, 2017 08:46:34 #
straightUp wrote:
That's a good point to make linda... you might consider the possibility that your own comprehension of someone else's claim might not be 100% accurate either. I do see a lot of claims that global warming is making hurricanes stronger or more frequent and I see a lot of people misreading that and assuming they mean "causing" hurricanes. Maybe not you, but enough to see a stereotype.
Yes, it is a good point.. something we should all take into consideration..
I've read enough literature and taken a couple classes on better communication skills to know when people engage in discussion frequently like 87 to 92 % of the time what we said is misunderstood..When you take a minute to add; this is what I heard is that what you meant you will see the other person's interpretation was not what you were really saying..
I'm never 100% accurate nor do I need to be, it's in discussing things that we may learn more or not.. For some they have an absolute need to be right and they then lose focus to the topic and I lose interest in furthering the discussion.. a happy compromise don't you think??
Global warming runs in cycles, it does impact our resent temperatures etc, I don't think people deny that what they deny is that it is man made..
You present data and facts at least and from what I've read have a balanced opinion but your also a dang brat at times too..

Have a great day straight up..
Sep 13, 2017 09:15:37 #
lindajoy wrote:
My post was an inquiry given my inability to find more on what you said..
I supplied the data I read and shared it with you helping your comments or not..
It's an interesting topic and learning a great tool from it..
I supplied the data I read and shared it with you helping your comments or not..
It's an interesting topic and learning a great tool from it..
Yes, it is interesting. I never stop learning from it either.
lindajoy wrote:
As for winning an argument or not is that your purpose when posting or in your rebuttal?? If so, why??? Is that important to you?? If so , why??
As for winning an argument or not is that your purpose when posting or in your rebuttal?? If so, why??? Is that important to you?? If so , why??
I suppose to some degree winning an argument is part of the reason for posting, but it's rarely the main motive for me because I know how impossible it is to "win" an argument on a political site like this. As you know, the arguments that get posted are often samples of the bigger political arguments at the national and even the international levels. From the alarmist side of these argument it it very much a matter of changing politics to affect the problem itself (concern for the future). With deniers negating the very possibility of human effect, it's hard to imagine the counterarguments operating on the same plane and so the better explanation for their counterarguments is to to simply discredit the alarmist arguments (winning an argument).
lindajoy wrote:
Debating an issue is to learn more from it not massage an ego..
Debating an issue is to learn more from it not massage an ego..
Mmm, I think for some people, "learning" that can be a benefit of debate, but I don't think that's always the point of a debate. In fact teaching, or at least explaining is probably a stronger purpose as debates are often used to convince other voters to change their minds about something, especially at places like the Senate floor.
Check out topic: Abnormally hot summer is predicted
Sep 13, 2017 09:23:08 #
lindajoy wrote:
Yes, it is a good point.. something we should all ... (show quote)
yes, I do. :)
lindajoy wrote:
Global warming runs in cycles, it does impact our resent temperatures etc, I don't think people deny that what they deny is that it is man made..
Global warming runs in cycles, it does impact our resent temperatures etc, I don't think people deny that what they deny is that it is man made..
Yes, I get that... I remember noticing, probably about 10 years ago, when the bulk of denial shifted from denying that the planet is warming to denying that humans have anything to do with it. I'm just wondering how long it will take before THAT argument fails to obscure the evidence.
lindajoy wrote:
You present data and facts at least and from what I've read have a balanced opinion but your also a dang brat at times too..
Have a great day straight up..
You present data and facts at least and from what I've read have a balanced opinion but your also a dang brat at times too..
Have a great day straight up..
Thanks linda, you too.
Sep 13, 2017 10:51:04 #
straightUp wrote:
Mmm, I think for some people, "learning" that can be a benefit of debate, but I don't think that's always the point of a debate. In fact teaching, or at least explaining is probably a stronger purpose as debates are often used to convince other voters to change their minds about something, especially at places like the Senate floor.
"I hit this and laughed good!! So very true but debating the challenge;
"suppose to some degree winning an argument is part of the reason for posting, but it's rarely the main motive for me because I know how impossible it is to "win" an argument on a political site like this."
Believe it or not I have changed an opinion because of the clear logic in what the other person shares..Not often but I have and I appreciate the learning or at least considering a different theory or fact.. That's why I say a learning expierence, that and I do love people.. Each of us our own identity and so unique..
Sep 13, 2017 11:07:19 #
straightUp wrote:
Thanks linda, you too.
Thank You as well...
Once again you got me laughing...
"Yes, I get that... I remember noticing, probably about 10 years ago, when the bulk of denial shifted from denying that the planet is warming to denying that humans have anything to do with it. I'm just wondering how long it will take before THAT argument fails to obscure the evidence.
The answer~~~ NEVERRRR~~~lol
But look at this way, great topic...
Here's my everyday climate change.. 53* this morning, high of 85.. This state green everything... They do a fantastic job in keeping her healthy too...

Sep 14, 2017 17:12:47 #
Morgan wrote:
Here' what'sreally funny, your reply is no surprise.
You falling for the greatest hoax in history is definitely "no surprise".
No science like junk science....to make a buck.
If you want to reply, then register here. Registration is free and your account is created instantly, so you can post right away.