Why the far left despises Christianity.
Apr 5, 2024 13:55:32 #
Kevyn wrote:
The age of the world for one. Half of the content of the Old Testament is abject nonsense. Noah’s ark is listed with dimensions, what they claimed it carried wouldn’t fit on a dozen huge container ships.
Answer this question Kevyn. What does the Bible say about what animals were on the ark?
Apr 5, 2024 13:57:57 #

LiberalGrammyD wrote:
Not All The Left are Atheists, Agnostics...etc There are Liberals who are Christian.
Jimmy Carter is a devout Christian. Faithful to his wife, uses no profanity dedicates his life to serving the poor and the nation. He walks the walk and talks the talk. He is a true Christian. The opposite of the spray tanned adulterous grifting lying Bible salesman.
Apr 5, 2024 14:03:32 #
Kevyn wrote:
Jimmy Carter is a devout Christian. Faithful to his wife, uses no profanity dedicates his life to serving the poor and the nation. He walks the walk and talks the talk. He is a true Christian. The opposite of the spray tanned adulterous grifting lying Bible salesman.
Another accusation, Kevyn.
Did you know that One of the biggest tools of Satan is Accusations.
Why will you not answer my previous question about the animals on the ark?
Check out topic: Quality service!
Apr 5, 2024 14:58:23 #

Kevyn wrote:
The age of the world for one...
The Velocity of Light and the Age of the Universe
Much modern research in astronomy and physics is built on the assumption that the velocity of light is one of the few things that is truly consistent. Computer analysis of the measurements of light velocity recorded since 1675 shows otherwise and points to a beginning—a creation of light and a subsequent slowing down of this created light. The date of this beginning appears to support the short Biblical chronology.
If I propose that the universe and all in it is the product of an act of Creation only 6,000–7,000 years ago, many people ask, “How is it that objects millions of light years away can be seen? Surely such light would take millions of years to reach us.”
The question is a valid one and several types of answers have been proposed to it in the past with only limited success.
There is one answer which I believe solves not only many of the observational problems of astronomy and Genesis Creation, but has wide ranging implications for the whole of the physical sciences.
The basic postulate is that light has slowed down exponentially since the time of Creation. This thought is radical and at first looks outside of confirmation. However, there are at least 40 observations of the speed of light since 1675 which support this suggestion.
The Velocity of Light 1675:1976
The values of the velocity of light (C) listed in Table 1 form the bulk of the data which I have used to investigate the concept of light decay.
Conclusions from Table 1
From the figures the drop in c is very evident, amounting to about 1507 km/sec. in 300 years. One additional feature is also striking, namely the rapid rate of tapering off in the rate of change of c per year. De Bray equated it to about 4 km/sec. on figures from 1870–1920; Tolles noted it at about 0.3 km/sec. per year about 1950. In addition, it is worthy of note that the observed change in c over three centuries is far greater than the margins of error in the observations, the error in Romer’s value being only one sixth of the observed change in c. The above results compels one to formulate a new theory for the behavior of light.
The Decay curve of light
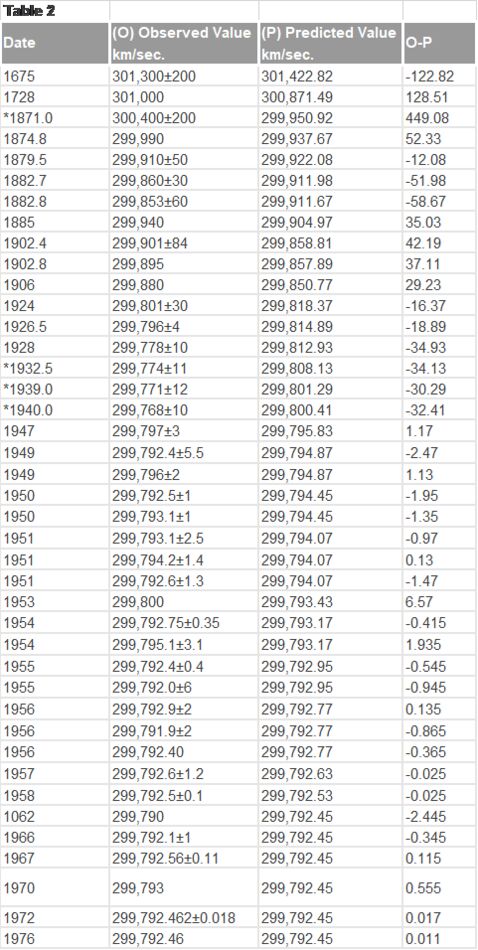
Table 2 summarizes the data used to determine the decay curve. A large number of possible curves were tried to fit the observed data points. Exponential curves could not reproduce the observed rates of change at the different dates or the observed values. Generally, these curves went below the points. Power curves, polynomials, logarithmic and hyperbolic functions were all tried with lack of success. There was only one curve tried which fitted the data points exactly and reproduced all of the observed features. Its general form is a log sine curve, with a logarithmic vertical axis, typical of most energy functions. The general equation is Log c = A + B (Log sine (T)) where A and B are constants that have the respective values of 5.47682068 and -1.94665385. It is of interest to note that this curve is similar to those accepted as decay curves of novae and supernovae. The time function T expresses the years (t) of time elapsed since Creation in a scale of degrees. For example, if we take 6,000 years as being the complete range of the curve, these 6,000 years take up the 90 degrees of the Log sine scale so the transformation to obtain (T) in degrees is T = (t/l) x (90/6000): that is T = 0.015 t. Since the computer on which this was calculated was working in radians, the transformation was T = zt where z = 11/12000 = 0.261799387799 x (1/103), which gives T in radians.
One must, of course ask the question, has the change in the value of c been due to improved measurement techniques.
As may be seen from Table 2, the observed values of c lie close to the predicted curve, and when the limits of error are considered nearly all observations fall within the predicted value. The only outstanding exceptions to this are those marked *. One of these (1871) was admittedly an inexact measurement. Those from 1932–1940 were all commented upon by Froome & Essen as giving results significantly different from anticipated values (as was 1928). These four exceptions were omitted from the final plot of points. The so-called “Coefficient of Determination,” r2, which is a mathematical expression showing how exactly the curve agrees with the observed points, had a value of one to nine significant figures, indicating a near perfect fit to the data. It is of interest to note that as experimental techniques improved over the 300 years, the difference between the observed and predicted values decreased. All told, 17 values were above the curve and 21 below, the r2 value indicating a perfectly balanced distribution of the cluster of points as well as close proximity to the curve. The total average error is 23.53 km/sec. The total average value is 299,894 km/sec. Thus, the average percentage error in the observations is 0.00785%. This compares with a drop in c of 0.5%. Thus, the average percentage error is only 1.6% of the total difference in measurement over the last three centuries. It is notable that the error bars show that it is not possible to draw a straight line from the lower limit of the last in the series. This clearly shows that a systematic decay in c has occurred. In addition, there are four instances where separate observations in the same year occur with one being above the curve and one below but whose error bars do not reach the curve. This proves that the experimental error estimation in those cases is incorrect and that the curve is therefore more accurate. This should hardly be surprising as a large number of results put together are more likely to give a true total picture than isolated or single experiments. Thus, the curve through the set of results has a higher probability of being correct than the individual experiments and we can safely conclude that by accepted rules of statistical analysis the probability of the change being due to experimental error is essentially zero.
When did decay commence and finish?
The decay curve is quite sensitive to its date of origin. If this is set too early, the curve comes in below the early clusters of points. If the date is too late, it comes in above the observed values. The best date of origin for the curve as determined by the observational evidence is 4040 BC±20 years. This date of origin would refer to the time of Creation/Fall. In a similar manner the cutoff date beyond which there is a zero rate of change in the value of c (i.e. the data at which c becomes constant) is quite critically determined by the final cluster of points from about 1947 onwards. From these observations it would seem that beyond 1960 the speed of light had reached its minimum value and was constant thereafter.
This conclusion raises the obvious difficulty as to how one verifies a process which has occurred in the past but is not occurring in the present. To answer this, we would point out that the curve is solely dependent on actual observations and refer the prior paragraph where the observed values of c from Table 2 were discussed which lie close to the predicted curve.
Application of a change in c
To give some idea of the trend of values, the speed of light was 391,966 km/sec. at AD 1 according to the curve. If we accept the short Biblical chronology of 1,656 years from Creation to the Flood, the curve predicts a value at the time of the Flood (2384 BC) of 1,621,908 km/sec. Thereafter the rise is steep. At 3540 BC the value was 15,783,104 km/sec. while at 3940 BC it touched 360,146,768 km/sec. The origin of the curve is virtually asymptotic, but a very good estimate of the actual initial value is given by the curve at one to 1.5 days from its origin. The speed of light was then about 1.5 x 10¹⁷ km/sec. or roughly 5 x 10¹¹ faster than it is now. I will assume that this value held from the time of Creation until the time of the Fall, as in my opinion the Creator would not have permitted it to decay during his initial work. At the same time, I propose that this initial high value of c would have produced the appearance of great age to the universe in that one week (to those who look with eyes and minds fixed on the current value of c).
Integration over the curve shows that our initial problem of light traveling millions of light years in only 6,000 years, is solved and that one major problem associated with the quasars is overcome also. The total distance traveled by light since Creation would be about 12 x 109 light years.
It is interesting to note that the new determination of Hubble’s Constant corrected for the movement of the local group of galaxies towards Virgo super cluster gives a new distance for the limit of the observable universe of 7-9 x 10⁹ light years. Thus, the proposed figures are in strict accord with recent findings.
There is also now no problem with the movement of material in quasars faster than the current speed of light; indeed, it is to be expected in objects so close in time to the Creation, and it is observed (See Science News, 110:40, 1976 and Nature 267:211–213, 1977). In addition to a number of others, quasar 3C 345 and quasar 3C 287 show this effect well; the former has two components flying apart at 2.5 times the current value of c, the latter has it several orders of magnitude greater according to some notes about quasars. This is no longer a problem. Likewise, the periods of variability of the quasars do not indicate a small size which is the conclusion based on a fixed value of c and in apparent disagreement with their energy. Indeed, half a year after Creation c was still 1.08 x 10¹³ km/sec. or about 3.6 x 10⁷ faster than now—traveling about 98,600 light years in 24 hours. As most large galaxies are about 100,000 light years across, it is not difficult to see how variations in intensity of light with a period of several days can be achieved for the whole object.
Conclusions
The general equation of the curve fitting the data points is Log c = A + B (Log sine (T)). It has its origin at 4040 BC and the speed of light then was about 5 x 10¹¹ faster than now, a value which probably held throughout Creation week. The speed of light became constant about AD 1960. In comparison to the data points, the predicted curve stands up well to four types of error analysis. The value of r2 is one to nine figures indicating a perfect fit to the data. The probable error given by the Observed values minus the Predicted values nearly always lies within the limits of experimental error. The plot of error bars proves it is not possible for c to have been constant since AD1675 (See Appendix 3). The average percentage error in the observations is 0.00785% which is only 1.6% of the total difference in measurement in 300 years. The problem of the total distance that light has traveled is solved as the curve shows the value to be about 12 x 109 light years in 6,000 years. The problem presented by quasars exhibiting speeds greater than the current value of c is solved as also is the short period of light variability of some of them when compared to their size. Thus, a decrease in the value of c with time is not only in accord with observation, but also explains some otherwise unexplainable facts very adequately.
TABLE 1
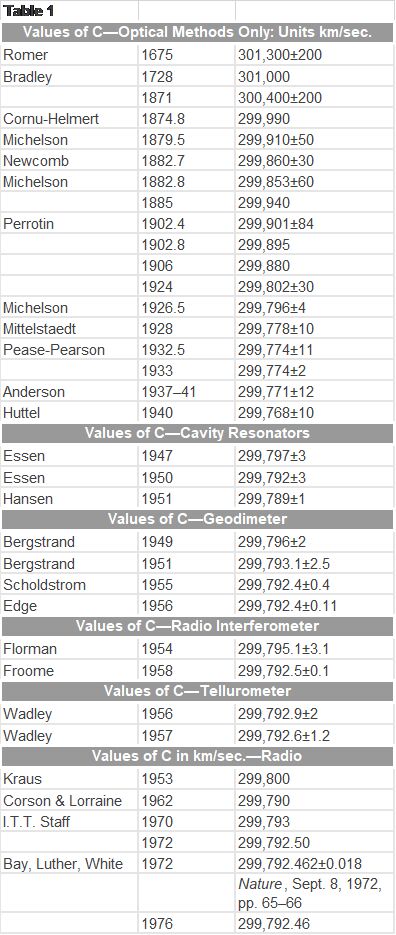
TABLE 2
Apr 5, 2024 15:22:16 #
Parky60 wrote:
The Velocity of Light and the Age of the Universe ... (show quote)
A very tough read parky

Apr 5, 2024 15:44:55 #
Bruce123 wrote:
A very tough read parky
I purposely made it that way for Kevie... but it's all based on science, something that Kevie says he believes in.
Apr 5, 2024 16:01:12 #
Kevyn wrote:
The age of the world for one. Half of the content of the Old Testament is abject nonsense. Noah’s ark is listed with dimensions, what they claimed it carried wouldn’t fit on a dozen huge container ships.
With your usual un-belief you put God in a box and deny his miracles!! God knew what HE was doing and you do not!!
Apr 5, 2024 16:13:08 #

Milosia2 wrote:
American Christianity today .
The Taliban , with Bacon and Beer. !!!
The Taliban , with Bacon and Beer. !!!
I'll take the bacon and beer!
Apr 5, 2024 16:38:18 #

Bruce123 wrote:
The left seems to always speak in broad generaliti... (show quote)
=============

 Those are the reasons why Lucifer hates Jesus!
And the left feels guilty of their crimes. They ignored it.
Why the left is considered evil.
" The Left Hand of (Supposed) Darkness
The word sinister, suggestive of darkness or evil, comes from a Latin word meaning “on the left side.” The association of “left”
Why is the right hand powerful?
Jesus sits at the right hand of the Father.
https://www.gotquestions.org/right-hand-God.html
Apr 6, 2024 05:43:22 #
saltwind 78 wrote:
Bruce, Cool, That's just what I am. I have no use for the so called Progressive wing of the party. I consider myself a FDR-JFK liberal.
As My parents were and I added WJ Clinton and Barak OBama. Thanks saltwind for this.Apr 6, 2024 11:17:27 #
Parky60 wrote:
The Velocity of Light and the Age of the Universe ... (show quote)
Parky, just for fun, I ran this post, including tables, to a friend of mine who is a physicist. Not sure of where your post originated but here is his reply:
Hi Bernie — I have heard about this sort of thing before (“tired light models”). This particular explanation is an exercise in fitting numbers with no meaning. What the person doing the fitting doesn’t understand is that many of the measurements are really the same because of the uncertainties in measurement. I also don’t believe the quoted uncertainty in Romer’s measurement (the first measurement in the table) — it is far too small.
The point is that a measurement of 301,300 plus or minus 200 and a measurement of 300,000 plus or minus 500 agree with one another. The measurements are not different. So fitting a curve to the different numbers is meaningless.
The reason I think that the uncertainty in Romer’s measurement of 200 km/sec is far too small; is that, back in the late 1600’s, the distances in the solar system were not all that well-known and time-keeping devices were only accurate to within a few seconds. A better estimate of the uncertainty in Romer’s measurement would be in the 1000‘s of km/sec, which puts it agreement with the current defined value of 299792.456 km/sec. This value is really used to define the length of a meter in conjunction with the definition of a second. We do this because, as far as we know, the speed of light is the same in all inertial reference frames.
We have models that indicate that the value of the speed of light is critical for nuclear reasonances and so if it were different at different times in the universe’s history, we would have to explain the elemental abundances in the universe in a very different way. Nuclear reasonances help us understand how you can make carbon out of hydrogen for instance (well, hydrogen to helium to carbon to magnesium). This only one of the models for which the speed of light is critical. All electromagnetic phenomena (stuff involving light interactions) depend upon the speed of light as well — this impacts chemical reactions as well as nuclear reactions. All our wavelength (or energy) measurements of light would have to be thrown out as well, if the speed of light were different in different epochs of history… Lots of model problems.
But, these are all models, so what do we know anyway? I can say definitively, that from a scientific perspective, what the guy is arguing is extremely bad science, because he doesn’t understand the process of scientific measurement — uncertainties are an estimate of how well you think you know a value. Those uncertain estimates can be mistaken as well.
Check out topic: Zelensky blasts West for wanting conflict to end
Apr 6, 2024 11:42:54 #
bylm1-Bernie wrote:
Parky, just for fun, I ran this post, including ta... (show quote)
Tell me Bernie, is your friend a believer?
Apr 6, 2024 11:56:12 #
Parky60 wrote:
Tell me Bernie, is your friend a believer?
He definitely is, Parky. In fact he is my stepson. He and his wife are solid Christians. He knows Scripture like the back of his hand and can defend every bit of it. There may be some things that he can't answer, as probably all of us have. The defense of the "Young Earth" is probably one of those but I think he will explain it by saying that God is omnipotent and nothing is impossible, a defense that has the unbeliever jumping all over the place.
Apr 6, 2024 12:06:58 #
bylm1-Bernie wrote:
He definitely is, Parky. In fact he is my stepson. He and his wife are solid Christians. He knows Scripture like the back of his hand and can defend every bit of it. There may be some things that he can't answer, as probably all of us have. The defense of the "Young Earth" is probably one of those but I think he will explain it by saying that God is omnipotent and nothing is impossible, a defense that has the unbeliever jumping all over the place.
Thanks for the reply.
Apr 6, 2024 13:04:32 #
Bruce123 wrote:
The left seems to always speak in broad generaliti... (show quote)
============
John 1:5
Jesus came as light, but darkness did not understand it.
America is very dark and violent when Biden and his team took over!
If you want to reply, then register here. Registration is free and your account is created instantly, so you can post right away.