FBI chart / why America is Burning
Jun 23, 2020 01:11:25 #


Jun 24, 2020 08:45:53 #
zombinis3
Loc: Southwest
Oldsailor65 wrote:
FBI chart / why America is Burning
Sorry messed up on the sequence
Actually this is what the protesters are up in arms about ;
This is how the info is collected
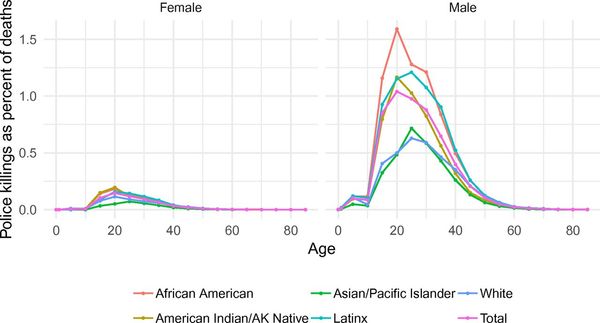
We use data on police-involved deaths to estimate how the risk of being killed by police use of force in the United States varies across social groups. We estimate the lifetime and age-specific risks of being killed by police by race and sex. We also provide estimates of the proportion of all deaths accounted for by police use of force. We find that African American men and women, American Indian/Alaska Native men and women, and Latino men face higher lifetime risk of being killed by police than do their white peers. We find that Latina women and Asian/Pacific Islander men and women face lower risk of being killed by police than do their white peers. Risk is highest for black men, who (at current levels of risk) face about a 1 in 1,000 chance of being killed by police over the life course. The average lifetime odds of being killed by police are about 1 in 2,000 for men and about 1 in 33,000 for women. Risk peaks between the ages of 20 y and 35 y for all groups. For young men of color, police use of force is among the leading causes of death.
https://www.pnas.org/content/116/34/16793
If you want to reply, then register here. Registration is free and your account is created instantly, so you can post right away.